Specimen Transport Systems
Design issues in creating efficient Pneumatic Tube Transport networks
Author: Simon Maasz - Quirepace Limited
INTRODUCTION
Although Pneumatic Tube Systems (PTS), have existed for over 100 years, they increasingly provide an efficient and cost effective solution to many of the major transportation problems in health care premises. A successful installation relies upon the network design being suitable for the requirements of the user. However, specifications for PTS written by potential users during the procurement process tend to focus inappropriately on features and engineering details rather than on network layout and performance. Where performance criteria are given, the data is often too general to allow a detailed performance analysis to be carried out. A better understanding of the design issues affecting a PTS leads to better specified systems that deliver a higher level of performance and generate higher levels of user satisfaction with the equipment.
The objective of this article is to introduce some of the steps in the design process of a large PTS network, to look at some of the potential problems and to take a brief look at some key network components. Many of the concepts are common to other transport mechanisms including track systems and an understanding of them can help in avoiding simple design pitfalls.
At the present time interest in PTS by European and US hospitals has never been greater; the size and complexity of installations continues to grow and the importance of the PTS network to the overall efficiency of the hospital is continually increasing. One of projects is the PTS network at Leeds General Infirmary, in the UK. This installation, which is probably the largest in a UK hospital, has around 4,500m of tube, 90+ stations and 10 independent systems forming the network. It handles around 24,000 carrier movements every week which equates to a daily carrier total distance traveled of around 600km; a quite staggering statistic. The procurement process for this installation was enhanced by the fact that the United Leeds Teaching Hospitals NHS Trust had a very clear understanding of the performance they were looking for from a PTS network and focused equally on system layout, design, price, features and engineering detail.
The data that were acquired during the design period of the installation of this network have provided a foundation upon which to base a model which has proved relevant for other hospital sites. The Leeds experience has proved particularly useful because now that the network has been operational for around 18 months it is apparent that real world use conforms very closely to this design model.
PERFORMANCE REQUIREMENTS
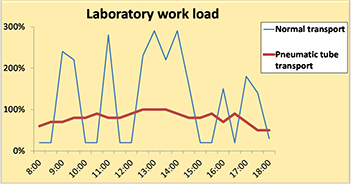
It is easy to understand why hospitals are looking closely at transportation problems, particularly with relevance to laboratory samples. With improvements to overall efficiency and turn around times coming from increased laboratory automation and electronic ordering and reporting systems, the transportation of the sample from the collection point to the point of analysis has a direct effect on the efficiency of the operation as a whole. This loop from the point of sample collection and test ordering, through transportation to the analytical area and subsequent results reporting has been termed by some the “Brain to Brain” process.
On a typical hospital site where the furthest extents are perhaps 500-800m apart, a carefully designed PTS network has the capability to deliver every transaction in under 10 minutes, with most of the transactions being delivered in 3-5 minutes. If priorities are used some transactions can be completed even faster.
This performance is realistically achievable, but for many installations performance is sacrificed upon the altar of cost saving. This is often not an informed decision; it is more likely a lack of understanding of the effect that a reduction in specification has on the overall performance of the PTS network. As the size and complexity of PTS networks increases the scope to introduce inefficiencies through poor design also increases. Unfortunately, a poorly designed network may introduce as many new inefficiencies as it seeks to remove.
An example of this is the shared station where, because of cost constraints, it is decided that several user groups can share a PTS station positioned in a fairly central location. It is possible, however, for demand on a shared station to be higher than the station’s capacity to deliver the service. There are three potential outcomes of this scenario all of which are inefficient, disruptive and frustrating. These are: The user may just stand and wait for the station to become available. Under most circumstances that user will not know how long they have to wait. The user may return to their post and revisit the station later, but there is no guarantee the station will not continue to be busy. The user may actually take out the carrier waiting in the station and replace it with their own. It is important therefore that when shared stations are planned the combined frequency of use is known and this type of problem alleviated.
DESIGN CRITERIA
Designing a successful PTS network means resolving three main issues:
- Deciding what the PTS is potentially going to transport.
- Looking at working practices, evaluating how the system will actually be used by hospital staff and predicting the likely carrier traffic.
- Designing the network to handle the predicted traffic.
A common experience is to find that whilst a hospital may know that a PTS will ‘bring benefits’ they have not actually decided exactly what they are going to use the PTS to transport.
MATERIALS TO BE TRANSPORTED
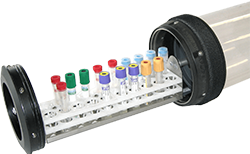
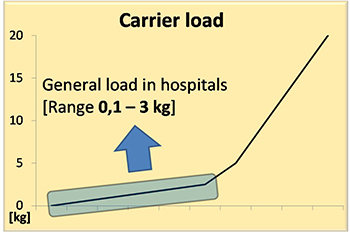
The list of potential payloads will undoubtedly include laboratory samples, but may also include pharmacy items, blood products, documentation, to name a few. Concentrating on laboratory samples which is usually the principal requirement, it is not enough when trying to quantify these to just have a global figure per week/month/year. To be able to proceed properly with the design of a PTS network it is necessary to apply some sort of categorisation to the global sample volume figure.


For example: how many of the samples are urgent? where do these originate? how many come from outpatient clinics? how many samples are from inpatient ward rounds? how many have been moved between different laboratories? It is necessary to calculate the sample volumes which fall into each category. These categories are not absolute. The aim is to achieve an understanding of the pattern of sample volumes to be transported so that the predictions for work practices which will be used in handling these sample groups can be applied.
WORK PRACTICES
Once it has been decided exactly what is to be transported the associated work practices can be considered. Without planning, the work practices will still adapt to the introduction of a PTS but there will be no guarantee, as was illustrated with the shared station scenario, that these will actually be efficient. The manner in which the PTS is used reflects the type of sample being transported. Hence the requirement to have some categorisation. For example: samples from areas such as Casualty and the Special Care Baby Unit will most likely be so urgent, and perhaps not repeatable, that users will send them one per carrier in the PTS for immediate attention. From outpatient clinics, where a regular flow of samples is generated through the day, users will tend to batch samples into a convenient payload and send a carrier from outpatients to the laboratory every 10 minutes or so. Samples collected from an inpatient ward round will probably be batched by ward and sent from the nearest station. Samples which move between laboratories will obviously be batched into different sample types.
When considering work practices, a common factor to consider is what happens where laboratories for different disciplines are not adjacent but where a number of samples are taken from the same patient. It is impractical to ask ward based staff to send different samples in different carriers to different laboratories for analysis, therefore the only workable model is one where all samples go to a central reception or clearing area and where some samples are then re-batched and sent on. It is necessary to clearly understand how this process will work because it directly affects the empty return carrier flow around the network.
TRAFFIC VOLUMES
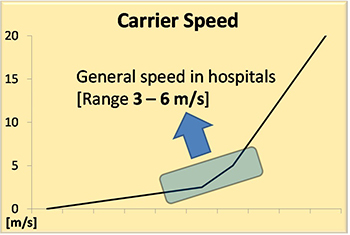
The objective of the design exercise is to predict the volume of carrier traffic on each section of the network during periods of peak activity. This is absolutely crucial because a PTS has a finite capacity to deliver a service. Generally it is only possible to move one carrier at a time with one exhauster in each section of tube, i.e., a network with five exhausters and consisting of 5 interconnected systems will be able to move 5 carriers simultaneously. Maximum throughput capacity of each section of the network is a function of tube length and carrier speed. For example, a 100m route between two stations with a carrier speed of 5m/s would take 20 seconds to move a carrier along the length of the tube. Add in a system switching time of perhaps 10 seconds to allow for the diverters, stations and valves to set up the air paths gives a total transaction time of 30 seconds or 120 carriers per hour. Since in many instances distances are more likely to be 2-300m, it is clear that the maximum capacity of each section of tube is easily reached.
There is an enormous difference in designing a network which has enough capacity to deliver and one which has enough capacity to deliver efficiently. For example, it is common to find a specification which states that the “desired network will have 15% spare capacity to allow for growth”. Taken literally the supplier could provide a system working at 85% of maximum capacity on day one and remain within the specification.
To look at the problem of ‘capacity to deliver’ properly one has to consider queue lengths and apply a little probability theory. As was mentioned previously, the objective is a network which can move everything within 10 minutes with a target of approximately 5 minutes. If a single transaction takes 1-1.5 minutes one can say that the objective is to achieve queue lengths of 4 or less, i.e., a carrier placed for sending in a station should never be more than number 4 in the queue. One has to consider probable scenarios as there are always unlikely but legitimate scenarios which fall outside of the parameters which one is trying to achieve. There is always a remote possibility, for example, that every single station on a network is loaded with a carrier simultaneously. The last carrier to move in this scenario could have to wait for a period well outside the 10 minute parameter before its turn to move came.
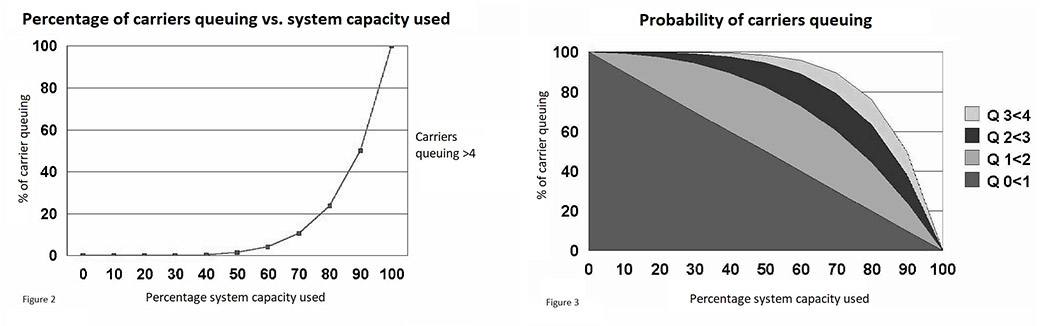
A PTS is a good example of a queuing system. It has a finite capacity to deliver and the demand placed on it is random and variable. Assuming one always has an equilibrium queue, i.e., one where the capacity to deliver is always greater than demand when measured over a reasonable time period, one can predict for different capacity loadings the probability of different queue lengths forming. To explain this concept consider a system with a capacity to make 60 transactions in each hour, i.e., where each transaction takes 1 minute. If it is predicted that one needs to move 30 carriers down this system it is known that we are loading it to 50% of its maximum. That is, in each hour there are an equal number of occupied and unoccupied 1 minute transaction slots. Because any carrier placed for loading has an equal chance of following either a free or occupied slot the probability of the queue length being between zero and 1 is 50%. In this example where the system is loaded to 50% of its capacity and the distribution of sends is random one can extend the calculations to show that whilst there is obviously some minor bunching of sends within the analysis period, because of the relatively light 50% overall loading, there is a 98% probability that all carriers will be in a queue of 4 or less.
By looking at the graph (Figure 3), we can see that until system loadings go beyond 50% almost all sends will be in a queue of 4 or less, but beyond 50% the proportion of carriers in this relatively short queue reduces sharply. If the graph is reversed (Figure 2), to show carriers queuing longer than 4 it is seen of course, that the graph turns steeply upwards beyond approximately 60% loading. The 60% threshold can therefore be considered a target capacity loading when designing a PTS network if the aim is to move the majority of carriers promptly. It can also be seen that designing a network where the predicted traffic occupies less than around 30% of the available capacity is, unless high growth rates are forecast, overkill and a waste of resources.
To summarize: by deciding exactly what is to be transported in the PTS, looking at the way the sample volumes convert to carrier volumes by predicting working practices and by designing a network where the predicted carrier traffic occupies between 30% and 60% of the available capacity on each part of the network we can, excluding improbable scenarios, achieve the objective of moving all transactions within 10 minutes.
BRINGING THE COMPLETE DESIGN TOGETHER
Whilst all the above provides a firm foundation for designing a network it is a little simplistic because each section of the network is being considered in isolation whereas in reality they are interactive. In a PTS network consisting of several interconnected systems, each able to move a carrier simultaneously, a complete transaction is likely to move from one system to another through a system link, coupler or interchange. The overall efficiency of the network is therefore affected by the performance of the hardware and software which make up the network.
On the largest networks the central interchange can operate as a “carrier server”. This system is in effect a large, robotic store and forwarding device, the efficiency of which depends upon effectively harnessing reliable hardware and sophisticated control software. (Figure 4) The input and output transactions to and from a central coupler need not be contiguous if the coupler has storage areas within itself that can temporarily hold incoming carriers and ‘serve’ them out to the receiving system as it becomes free. This central storage provides a solution to the design problem where carriers are queuing in a sending system because a receiving system is taking time to clear. Without central storage carriers queue at the station with all the access problems previously discussed, whereas with central storage within the system coupler, the queue can be moved away from the stations allowing users easier station access for subsequent transactions. Central carrier storage also gives some potential for performance improvements in absolute carrier throughput. If a carrier which is queued for a local transaction, is behind another carrier which has to cross the system coupler, moving the first carrier into the coupler central storage frees up the second carrier which will subsequently complete its transaction earlier.
In addition to layout and hardware performance, the efficiency of a PTS network depends heavily on the performance and durability of the control system and software which sits on top of the physical network. A full discussion of this subject is however outside the scope of this article. As has been alluded to efficient routing and use of the storage sites depends on intelligent algorithms based on a similar understanding of the capacity concepts discussed above.
CONCLUSIONS
Pneumatic Tube Systems can provide major benefits to large institutions where delayed transport of specimens, drugs, orders and reports produce bottlenecks in the delivery of patient care. Though superficially the technology is not sophisticated, in engineering terms to get the best performance from complete systems, great care must be taken at the design stage. This article has highlighted some of the fundamental issues and prospective purchasers of these systems are encouraged to seek informed advice in designing systems so as to avoid disappointment in final performance due to inappropriate cost cutting during procurement.